Sales Incentive Plan: Examples and Design Principles
A practical guide to designing a sales incentive plan—covering pay mix, quota-setting, accelerators, SPIFs, and the five principles that make variable comp actually change behavior.
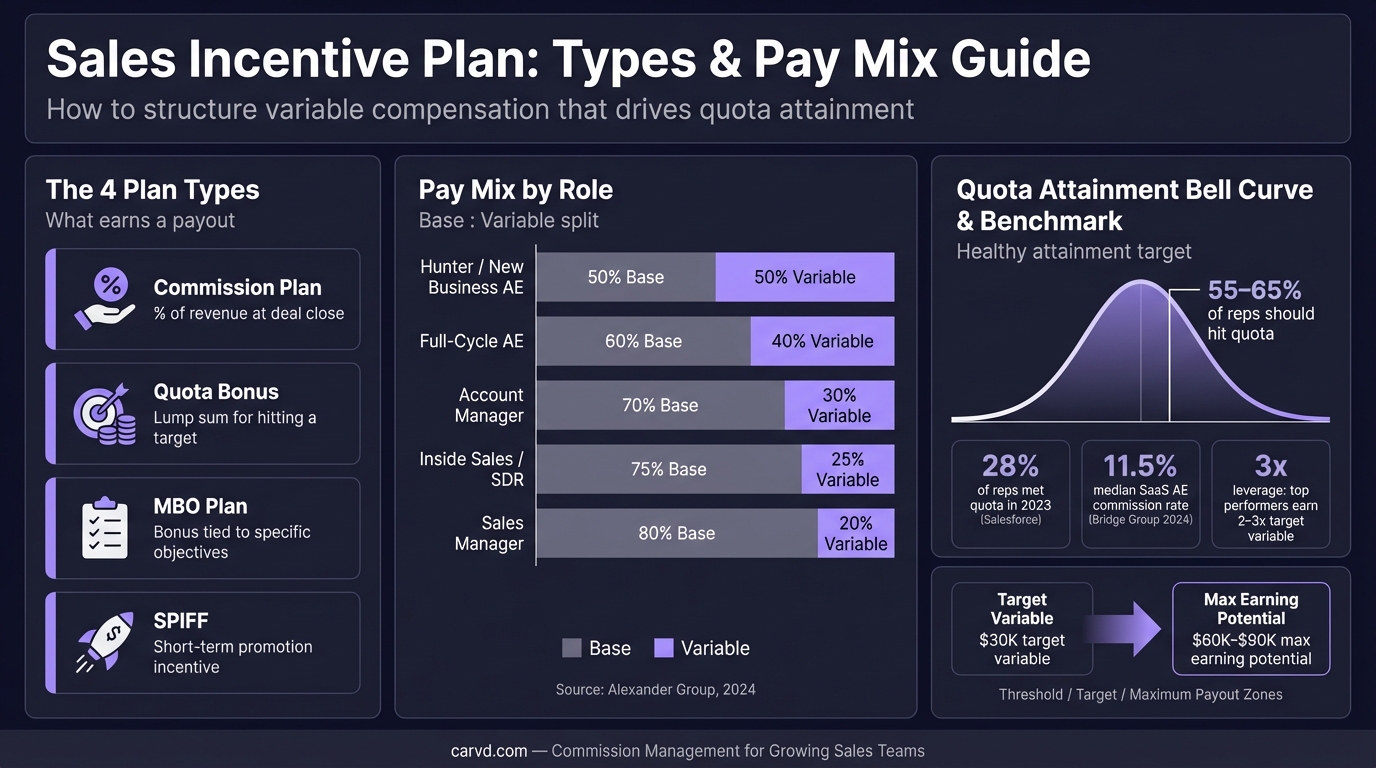
A sales incentive plan is the full set of variable compensation for your sales team: base commission structure, accelerators for overperformance, short-term SPIFs, and sometimes team bonuses. Most sales managers use the term interchangeably with "sales commission plan," but the full scope includes everything designed to connect rep behavior to financial outcomes.
The problem isn't that companies lack sales incentive plans. Only 19% of companies rate their plans as "highly effective," according to Alexander Group's 2024 Sales Compensation Trends Survey of more than 300 comp leaders. 89% of those same companies are actively revising their plans.
Most sales incentive plans don't fail because of bad math. They fail because reps can't see the link between their daily actions and their paycheck — or because the plan changed three times in 18 months without clear rationale.
What a sales incentive plan includes
A complete plan has four layers:
Base commission structure The rate a rep earns on closed deals, applied to revenue, ACV, or margin depending on your model. This can be flat (one rate for all deals), tiered (increasing rates at revenue thresholds), or per-product (different rates by offering). The sales commission structure guide covers each type with formulas and examples.
Accelerators Higher commission rates that apply above quota. According to ICONIQ Growth's 2023 Sales Compensation survey, 82% of SaaS startups use accelerators. A common structure:
- Under 100% quota: standard rate (e.g., 10%)
- 100–120% quota: 1.25x rate (12.5%)
- Above 120% quota: 1.5x–2x rate (15–20%)
Accelerators exist to make overperformance disproportionately valuable. Without them, top reps have no financial reason to push past quota.
SPIFs (Sales Performance Incentive Funds) Short-term bonuses for specific behaviors: closing a particular product line, winning deals in a new vertical, shortening sales cycles. SPIFs redirect selling energy quickly without redesigning the whole plan. According to QuotaPath's 2024 analysis of $7.3M in SPIF payouts, 95% of SPIFs were structured as commission bonuses rather than flat cash. Multi-year deal accelerators represented 15% of plans but generated 25% of total revenue on the platform.
Contest and recognition programs Leaderboards, President's Club, quarterly closing contests. These add visibility and social recognition on top of cash incentives. Research from a 2020 Harvard Business School paper by Chung and Narayandas found that self-selected incentives — where reps choose their own rewards — produce performance gains that persist even after the program ends. The practical implication: giving high performers some choice in how they're rewarded (cash vs. travel vs. experiences) can be more effective than uniform cash payouts.
Setting the pay mix
Before building any incentive plan, set the pay mix: how much of total target compensation is fixed (base salary) vs. variable (commission and bonuses at 100% quota).
Standard benchmarks from the Bridge Group's 2024 SaaS AE Benchmark Report (based on 170+ B2B SaaS companies):
| Role | Typical pay mix |
|---|---|
| Account Executive | 53% base / 47% variable |
| SDR | 70% base / 30% variable |
| Account Manager | ~60% base / 40% variable |
| Sales Manager | ~65% base / 35% variable |
Higher variable mix = higher risk for the rep, appropriate for roles with direct revenue control. Lower mix fits roles with longer sales cycles or less direct deal influence.
If you're hiring competitive AEs and your plan has a 70:30 or lower variable ratio, expect pushback. The market standard for full-cycle AEs is close to 50:50.
Setting quota correctly
The most important number in a sales incentive plan isn't the commission rate — it's the quota.
Alexander Group's 2024 data shows that well-designed plans target 55–65% of sellers achieving 100% of quota. Too low (under 40%) and you're either overpaying for easy attainment or demoralizing the majority. Too high (over 75%) and you've set quota below where it motivates stretch behavior.
In practice, quota-setting often has a political dimension. ICONIQ Growth found that 58% of companies over-assign quotas by 20–30% above their actual revenue plan to build in buffer. That's a trade-off: more buffer means more quota misses, more rep burnout, and higher voluntary turnover.
The market-wide data is striking: Salesforce's 2024 State of Sales report found that only 28% of reps met quota in 2023, down from 44% in 2022. When fewer than a third of reps hit target, the issue usually isn't rep performance — it's quota methodology.
Five design principles
1. Line of sight
Reps must be able to calculate their expected commission within two minutes of closing a deal. If they can't, the plan has too many variables, conditions, or time lags. Line of sight is the single biggest driver of whether variable compensation actually changes behavior.
A plan that pays "10% of ACV, plus 15% above quota, with an annual multiplier based on renewal rates calculated the following Q1" is one where reps stop tracking their own progress. They don't know what they're optimizing for, so they optimize for nothing in particular.
2. Fewer metrics, higher weight
Most research on incentive pay supports using one to two metrics per role — not five. The more metrics you add, the more you dilute the behavioral signal. If a customer satisfaction score is worth 5% of variable comp, reps will ignore it. If it's worth 20%, they'll manage it.
For quota-carrying sales roles, revenue or ACV is almost always the right primary metric. Gross margin, product mix, or deal size can be secondary — but secondary metrics need enough weight to matter.
3. Make commission calculations transparent
If a rep closes a deal and then a policy exception, returns process, or delayed CRM update reduces their payout weeks later without explanation, they lose trust in the plan. The result is shadow accounting: reps building personal spreadsheets to re-calculate what they think they're owed.
Shadow accounting is a hidden tax on selling time. The fix is transparent, auditable commission calculations — where reps can see exactly what drove their payout, down to the deal level, through rep dashboards that update as deals close. Tools like Carvd give reps a breakdown of how each deal contributed to their commission, which eliminates the most common source of comp disputes.
4. Cap SPIFs at 10–20% of variable comp
If SPIF income represents more than 20% of expected variable compensation, reps start planning their activity around SPIFs rather than quota. That creates distortion — delayed deals, cherry-picked product mix, or timing manipulation to align with SPIF windows.
Used correctly, SPIFs are tactical. Used as a substitute for a well-designed base commission structure, they're expensive and create the wrong behaviors.
5. Change plans at natural cycle boundaries
Commission plan changes mid-year signal instability and often feel like the company is moving the goalposts on already-earned income. Alexander Group's 2024 data shows the top three legitimate triggers for plan changes are: (1) profitability focus, (2) sales strategy shift, and (3) new product launches.
If you're changing the plan for one of those reasons, communicate the business rationale directly. Reps who understand why a plan changed accept it. Reps who only hear about the what assume the company is taking money away from them — even when the change is revenue-neutral.
Common mistakes
Uncapped commission without a margin check: Uncapped plans feel competitive but can create commission expense surprises at high attainment. Before offering uncapped variable, model what commission expense looks like at 150% quota. See the uncapped commission guide for when they make sense.
Draw against commission for ramp: Draws solve a short-term cash flow problem for new reps but can create confusion about true earnings vs. advances. If you use a draw, be explicit whether it's recoverable (must be repaid) or non-recoverable (forgiven). The draw against commission guide covers both structures.
Accelerators with too-high thresholds: An accelerator that only activates at 150% of quota might as well not exist. Fewer than 10% of reps will hit it, which means it costs nothing and motivates no one. Effective accelerators start at 100–110%.
Payout timing over 30 days: Reps paid 60–90 days after close lose the psychological connection between behavior and reward. Monthly payout cadences are standard and should be default — fast payroll export helps close the gap between calculation and payment — unless your plan structure genuinely requires annual reconciliation.
A starting plan structure
For a 10–25 rep SaaS sales team, a baseline sales incentive plan:
| Component | Structure |
|---|---|
| Base salary | 50% of OTE |
| Commission (under quota) | 10–12% of ACV |
| Accelerator (100–120% quota) | 15% of ACV |
| Accelerator (above 120% quota) | 20% of ACV |
| Quota | Set so 55–65% of reps hit 100% |
| SPIF budget | 5–10% of total variable budget |
| Payout timing | Monthly on closed-won |
This covers the mechanics. Run these numbers through the commission calculator to verify payouts at 80%, 100%, and 120% attainment before sharing with reps. The harder work is quota methodology and making sure your commission calculations are accurate and visible to reps. The variable compensation guide covers how to adjust pay mix and plan type for different sales roles.
Last updated: March 22, 2026