Annual Incentive Plan: How to Design One That Drives Results
A practical guide to designing an annual incentive plan for mid-market companies, with target percentages, payout curves, and metric benchmarks.
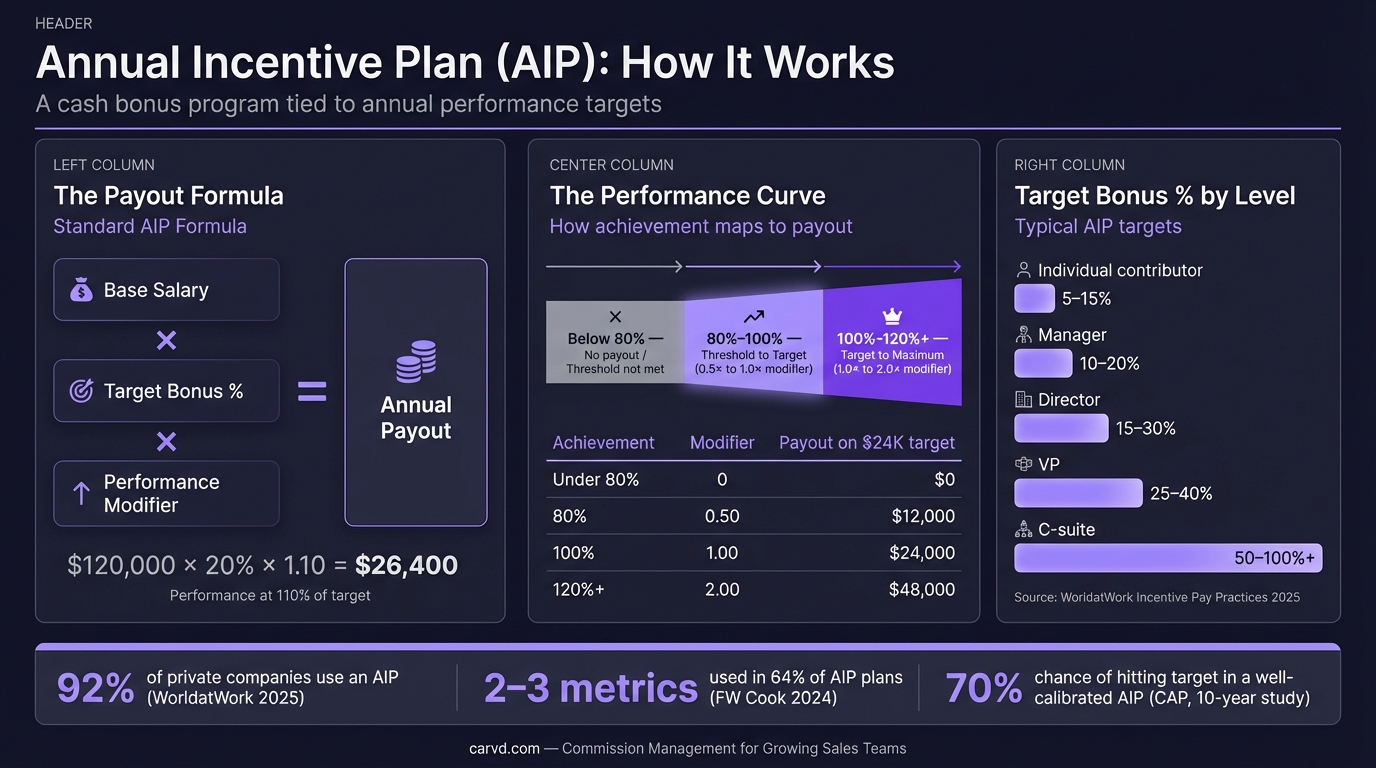
An annual incentive plan (AIP) is a bonus program that pays employees a variable cash amount — typically once per year — based on reaching specific company, team, or individual performance goals. 90% of organizations use an AIP as their primary short-term incentive vehicle, according to WorldatWork's Incentive Pay Practices 2025 report.
Despite that prevalence, most published AIP guidance is written for large public companies with dedicated compensation committees and SEC disclosure requirements. This guide is written for companies with 50 to 500 employees: smaller companies that want to run a principled annual bonus program without the overhead of an enterprise comp function.
AIP vs commission plan: the most important distinction
Before designing anything, it helps to be clear on what an AIP is not.
A commission plan pays on deal close. Payouts are monthly or quarterly. The line of sight between effort and reward is direct: close a deal, earn commission. Commission plans are designed for sales roles because that directness is what makes them work as motivators. For a deeper look at how commission structures are built, see our sales commission structure guide.
An AIP pays once per year, after the books close. The link between any single employee's actions and the company's revenue is real but indirect — especially for non-sales roles. That's acceptable for managers and supporting functions because the goal isn't to replicate commission-style incentives; it's to align the entire organization behind shared outcomes.
The distinction matters for plan design:
| Commission plan | Annual incentive plan | |
|---|---|---|
| Who | Sales roles | Managers, executives, non-sales staff |
| Pay trigger | Deal close / individual quota | Company, team, or individual goal |
| Frequency | Monthly or quarterly | Annual (paid Q1 following year) |
| Cap | Often uncapped | Typically capped at 200% of target |
| Line of sight | Direct | Moderate to weak for junior levels |
One common exception: VPs of Sales and CROs often participate in both. They may have a commission plan tied to personal quota, plus an AIP tied to company metrics — total bookings, net revenue retention, or hiring plan achievement. For these roles, the AIP addresses what individual deal flow can't capture.
Who is eligible
Eligibility for annual incentive plans varies significantly by company. Meridian Compensation Partners' benchmarks show that approximately 50% of the salaried workforce is typically eligible, with participation concentrated at manager level and above. WorldatWork's 2025 data found that only 49% of hourly workers are included in short-term incentive programs.
A practical eligibility framework for a mid-market company:
- Executives (VP+): Eligible. AIP target percentages are high enough to be meaningful.
- Managers and directors: Eligible. This is the core use case for an AIP.
- Exempt salaried individual contributors: Consider eligibility carefully. Target percentages at this level are low (typically 10% of base), so the motivational effect is modest.
- Sales reps: Usually covered by a commission plan instead. Including them in an AIP on top of commissions adds complexity and cost without clear benefit for most organizations.
- Hourly or nonexempt employees: Eligible in some companies, but payout amounts are small and the administrative burden is not always justified.
There's no universally right answer. The question to ask: at a given role level, is the AIP target dollar amount large enough to influence decisions meaningfully throughout the year?
The six components of an AIP
Every annual incentive plan has the same basic architecture:
- Eligibility — Who participates
- Target bonus percentage — What each role earns at 100% performance
- Performance metrics — What gets measured
- Metric weighting — How the metrics combine into a score
- Payout curve — How scores translate to payouts
- Timing — When payouts are made
Getting each component right matters. An AIP where metrics are correct but the payout curve is poorly calibrated will fail as reliably as one with the wrong metrics.
Target percentages by role
Target bonus percentage is the bonus an employee earns when performance equals 100% of the goal. This is the number your plan is built around — everything else scales from it.
CAP Partners benchmarks for private companies:
| Role level | AIP target (% of base salary) |
|---|---|
| CEO | 80% |
| Other executives / officers | 40% |
| Managers / supervisors | 15% |
| Exempt salaried individual contributors | 10% |
| Nonexempt / hourly | 5% |
These are medians. Actual percentages vary by industry, company stage, and how much of total compensation is base salary versus long-term equity. A company with limited equity to offer may set higher AIP targets to compensate. A company with generous equity grants may set lower AIP targets because total compensation is already competitive.
For senior sales leaders specifically, target variable can be substantially higher. SaaStr data puts VP of Sales target variable at up to 100% of base salary — though that's often split between a commission plan and an AIP rather than being solely AIP.
The targets above are a starting point. Set the number you can defend against the market rate for that role level, not the number that seems easy to fund.
Metrics: what to measure
73% of companies now use three or more metrics in their AIP design, according to Harvard Law School Corporate Governance blog analysis of 2025 trends. The most common combination:
Financial metrics (CAP Partners 2024 Top 250 AIP Report):
| Metric | Prevalence |
|---|---|
| Revenue | 46% |
| Operating profit / EBITDA | 26% |
| Free cash flow | 25% |
Strategic / nonfinancial goals: 57% of companies include at least one nonfinancial goal — typically a product launch, hiring target, customer satisfaction score, or similar objective.
Financial metrics dominate weighting. On average, financial metrics account for roughly 90% of total bonus weighting in 2024, up from 85% in 2023, per Harvard Law School Corporate Governance blog analysis.
A workable framework for mid-market companies:
Weight the plan toward one or two financial metrics that are broadly understood (revenue growth, gross profit). Add one strategic goal that reflects the year's priorities. Cap total metrics at three for most roles — more than that and the plan becomes a performance review checklist rather than a focus-generating incentive.
Individual performance modifier: 64% of companies now use individual performance as a modifier to the formulaic score rather than including it as a standalone weighted metric (Harvard Law School Corporate Governance blog, 2025 analysis). This is up from 46% in 2022. The practical benefit: the plan stays formula-driven for most of the score, but a manager can adjust a specific employee's payout up or down (within a defined range, such as plus or minus 20%) based on their contribution. This avoids the problem of an employee who hit every individual goal while the company significantly underperformed.
Payout curve design
The payout curve translates performance scores into actual dollars. Standard design has three anchor points:
- Threshold: Performance at roughly 80% of goal pays 50% of the target bonus. This is the floor. Below threshold, no payout is made.
- Target: Performance at 100% of goal pays 100% of target bonus.
- Maximum: Performance at roughly 120% of goal pays 200% of target bonus. About 70% of companies cap at 200%, according to Meridian and CAP Partners data.
How to calibrate threshold and maximum:
Meridian recommends that threshold performance should be achievable in about 9 out of 10 years — it should be a real floor, not a participation trophy, but also not a scenario that only occurs in exceptional years. Target should be achievable roughly 7 out of 10 years. Maximum should be achievable 1 to 2 out of 10 years.
Run your own payout scenarios through the commission calculator to see how threshold, target, and maximum settings translate to actual dollar amounts at different performance levels. Historical payout distribution from CAP Partners' 10-year analysis of large U.S. companies (2013-2022 averages):
| Payout level | % of companies |
|---|---|
| Maximum (200%) | 2% |
| Between target and maximum | 24% |
| At target (100%) | 52% |
| Between threshold and target | 7% |
| At threshold (50%) | 10% |
| No payout | 4% |
The 2024 median corporate AIP score came in at 113% of target, down from 119% in 2023, per Harvard Law School Corporate Governance blog analysis. Most companies are paying at or slightly above target, which is consistent with the historical distribution.
The implication for calibration: if your company routinely pays at maximum, your goals are set too low. If you're frequently near threshold, the goals may be unrealistic or the plan is creating morale problems rather than motivation.
Common design mistakes
Setting the target bonus percentage without checking total compensation. A manager who earns a $90,000 base salary with a 15% AIP target has a $13,500 target bonus. If the market rate for that role includes $20,000 in target variable, the AIP isn't competitive — regardless of the percentage. Always validate against total compensation benchmarks, not just internal ratios.
Using too many metrics. Plans with five or more goals diffuse attention. A rep or manager can focus on two or three things at once. More than that, and the plan describes everything the company cares about without actually directing behavior toward any of it.
Setting metrics employees can't influence. If a junior manager's AIP is 80% weighted on company EBITDA margins set by corporate finance, the plan doesn't have line-of-sight — it has lottery mechanics. The further from the executive level, the more the AIP should weight metrics the employee can actually affect.
No threshold. Some companies set plans without a threshold payout, meaning any performance level above zero pays something. This removes the plan's ability to distinguish between a company that had a good year and one that barely stayed open. A threshold anchors the plan to real accountability.
Treating the maximum as aspirational. Maximum should be hard but reachable 1 to 2 times per decade. If it's never been hit in company history, it's not a maximum — it's a ceiling that exists to avoid paying more than management is comfortable with. That undermines the plan's credibility.
Forgetting to communicate it. An AIP that employees don't understand is paying for paperwork, not performance. Use the commission plan builder to model payout scenarios at different attainment levels, then present your annual incentive plan to stakeholders with Deckary. At minimum, every participant should know their target bonus amount in dollars, the two or three metrics being measured, and what performance levels trigger threshold, target, and maximum payouts.
A note on sales leaders in dual plans
For roles like VP of Sales or CRO, the sales compensation plan and an AIP often run in parallel. The commission plan captures individual deal performance — closer to the rep model. The AIP captures broader outcomes: total team bookings, net revenue retention, strategic hiring, or product mix goals.
When that's the case, commission calculations and AIP tracking need to run separately. Mixing the two into a single spreadsheet creates error risk and makes it difficult to show each participant exactly what drove their payout. A dedicated commission calculator handles the deal-level math so AIP reconciliation can focus on the broader metrics. Tools like Carvd handle the commission side, giving sales leadership full transparency on how their variable comp was derived deal by deal — which is especially useful when they're also reconciling an AIP payout at year-end.
Further reading
Understanding how variable compensation is structured across roles starts with the fundamentals. The variable compensation overview covers how companies split fixed and variable pay, and on-target earnings explains how OTE benchmarks relate to both sales and non-sales plans.
For the full context on incentive program management — including plan governance, dispute processes, and performance calibration — see our incentive compensation management guide.
Related reading: Sales Compensation Plan: How to Build One That Works · Variable Compensation: How It Works and When to Use It · Sales Commission Structure: Types, Examples & How to Choose
Last updated: March 22, 2026