Standard Commission Rates: Benchmarks Across Sales Roles
Standard commission rates vary by role: 8–15% for AEs, 2–5% on renewals for AMs, 2–3% override for managers. Here are the benchmarks your plan should match.
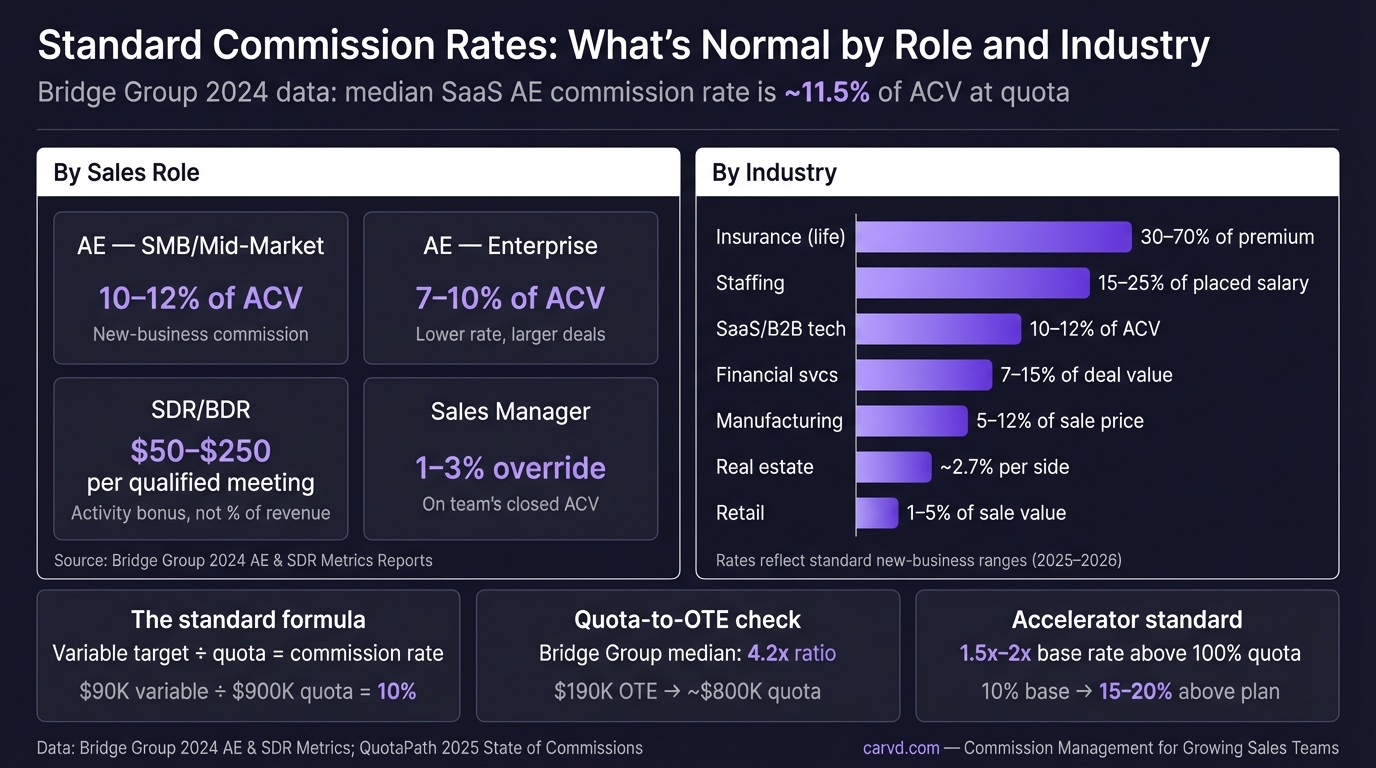
"Standard" commission rate is a useful concept that conceals a wide range. A 10% commission rate is standard in SaaS, unworkable in retail, and low in insurance. What counts as standard depends on the role, the industry, and the math that produces a competitive OTE.
Here are the verified benchmarks — by role and by industry — plus the framework for figuring out whether your rate is in range.
Standard commission rates by sales role
The most reliable way to benchmark rates is by role type. Each role has a distinct structure: AEs earn a percentage of closed revenue, SDRs earn activity bonuses, managers earn overrides. Comparing them as if they're the same thing produces bad decisions.
Account executives
For full-cycle AEs closing new business in B2B software and technology, 10-12% of annual contract value (ACV) is the standard range. Bridge Group's 2024 AE Metrics & Compensation report — drawn from 172 SaaS companies — puts the median commission rate at approximately 11.5% of ACV at 100% quota attainment, with median OTE of $190,000 at a 53:47 base-to-variable split.
| AE segment | Typical commission rate | Notes |
|---|---|---|
| SMB AE | 10-12% of ACV | Higher rate, smaller deals |
| Mid-market AE | 9-12% of ACV | Most common segment in SaaS |
| Enterprise AE | 7-10% of ACV | Lower rate, larger deals, longer cycles |
Accelerators above quota are standard: most SaaS companies pay 1.5x to 2x the base rate on revenue above 100% attainment. A 10% base rate becomes 15-20% on every dollar above quota.
Inbound vs. outbound. Reps handling predominantly inbound pipeline — warm leads from marketing — typically earn 1-3 percentage points lower than outbound reps building pipeline from scratch. The rate difference reflects the lower cost of customer acquisition when marketing has already done qualification work.
SDRs and BDRs
SDRs don't earn a percentage of revenue because they don't control close rates. The standard structure is a base salary with bonuses per qualified output — usually meetings booked or SQLs accepted by an AE.
Bridge Group's 2024 SDR Metrics & Compensation report puts median SDR compensation at 64% base / 36% variable, with median OTE around $80,000-$95,000 depending on segment.
| Output metric | Typical bonus range | Notes |
|---|---|---|
| Qualified meeting booked | $50-$150 per meeting | Common for outbound SDRs |
| SQL accepted by AE | $100-$250 per SQL | Focuses on pipeline quality |
| SAL (sales-accepted lead) | $75-$200 | Splits incentive across handoff |
Some companies add quarterly bonuses when SDRs hit pipeline contribution targets — for example, $2,000 for contributing $500,000 in pipeline per quarter. This aligns SDR output with downstream revenue without paying a commission on deals they didn't close.
Account managers and CSMs
Account managers handling renewals and expansions typically earn lower rates than new-business AEs. Standard ranges:
| Activity | Typical rate |
|---|---|
| New-business ACV (if AM closes new deals) | 8-12% |
| Expansion / upsell ACV | 5-8% |
| Renewal retention | 3-5% of renewed ACV |
| Straight renewal (no expansion) | 0-3% |
Some companies pay nothing on straight renewals and commission only on expansion. That's a legitimate plan design, but reps need to understand it before accepting the role — it's a significant difference from a plan that pays on the full renewal value.
Sales managers
Sales managers typically receive an override — a percentage of their team's closed revenue — rather than a direct commission rate. Override ranges:
| Role | Typical override |
|---|---|
| Front-line sales manager | 1-3% of team ACV |
| Director of Sales | 0.5-1.5% of org ACV |
| VP of Sales | 0.25-0.75% of total sales |
A team closing $5M per year with a manager override of 2% produces $100,000 in variable for the manager — meaningful at a $200K+ OTE without distorting individual rep incentives.
Managers shouldn't earn more from override than from managing their people well. Plans that make manager override large relative to base create incentives to hoard deals rather than coach reps.
Standard commission rates by industry
Industry structure determines the ceiling on commission rates. Gross margin, deal size, and sales cycle length vary enough across sectors that "standard" means something different in each.
| Industry | Typical commission rate | Structure notes |
|---|---|---|
| SaaS / B2B software | 10-12% of ACV | Plus accelerators above quota |
| Financial services | 7-15% of deal value | Higher for complex products |
| Insurance (life) | 30-70% of first-year premium | High rate compensates for low deal volume |
| Insurance (health) | 4-6% of premium | Subject to carrier caps |
| Real estate | ~2.7% per side | Post-NAR settlement data, 2025 |
| Medical devices | 5-15% of device revenue | Higher for capital equipment |
| Manufacturing | 5-12% of sale price | Higher for custom/complex solutions |
| Retail / consumer | 1-5% of sale value | Low margins compress rates |
| Staffing / recruiting | 15-25% of placed salary | Usually paid as a fee, not % of revenue |
The variance is large and expected. A staffing firm paying 20% commission isn't being generous — 20% is standard because the firm's margin on each placement is 20-35% of the placed salary. An insurance company paying 50% on a life policy isn't being extravagant — the policy premium might be $1,800 per year, and 50% commission is $900. The percentage looks high; the absolute dollars are modest.
What drives commission rate variation
Two reps at the same company with the same title can have meaningfully different effective commission rates if their territories, product mixes, or plan versions differ. The reasons rates vary:
Gross margin. The single biggest structural driver. SaaS with 75-80% gross margins can afford 10-12% commission rates. Physical products with 25-35% margins typically produce rates below 8%. Rates above gross margin aren't sustainable — the company loses money on each deal before accounting for any other operating costs.
Deal size. Small deal sizes require higher percentages to produce motivating dollars per close. A $5,000 deal at 10% commission produces $500 — not particularly motivating for a rep managing a multi-month pipeline. The same rate on a $200,000 deal produces $20,000, which is.
Sales cycle. A rep closing one $500,000 deal per quarter needs a higher per-deal payout than a rep closing 20 deals per month. Rates adjust to make the annual math work across different deal velocities.
Quota-to-OTE ratio. The most reliable check on whether a rate is "standard" is the quota-to-OTE ratio — how much quota is a rep expected to close for every dollar of OTE? Bridge Group's 2024 data puts the median at 4.2x for SaaS AEs: $190K OTE, roughly $800K quota. That implies a ~11.5% commission rate for a rep earning all variable.
A ratio below 3x usually means the company is paying above market for the quota it's setting. Above 6x, the company may be underpaying relative to quota expectations. Both produce problems: the first is expensive, the second drives attrition.
How to calculate your standard rate
If you're setting or reviewing a commission rate, the math runs backward from OTE:
- Determine market OTE for the role — use RepVue, Bridge Group, or Betts Recruiting data for your segment and geography
- Set base-to-variable split — 50/50 is standard for full-cycle AEs; 65/35 for SDRs
- Set quota at a 4-5x quota-to-OTE ratio based on realistic pipeline expectations
- Divide variable target by quota — that's your commission rate
Example: Market OTE for your AE role is $180,000. At 50/50, variable target is $90,000. At 5x quota-to-OTE, quota is $900,000. Rate = $90,000 ÷ $900,000 = 10%.
Check that rate against your gross margin. If gross margin is 72%, a 10% commission rate consumes 14% of gross profit per deal — typically sustainable once you account for overhead. If gross margin is 35%, 10% consumes 29% of gross profit, which probably leaves insufficient margin to cover operating costs.
For more on what makes a rate right for your specific situation, see what is a good commission rate and sales commission rates by industry.
Accelerators and kickers
Standard rates apply to quota attainment — not to every dollar a rep closes. Most plans modify the rate above or below quota:
- Below 50% attainment: Some plans pay nothing (cliff) or a reduced rate (50-75% of standard rate)
- 50-100% attainment: Standard rate applies
- 100-125% attainment: 1.25-1.5x standard rate
- Above 125% attainment: 1.5-2x standard rate
QuotaPath's 2025 State of Commissions survey found that 82% of SaaS companies use accelerators. But given that only 51% of AEs hit quota in Bridge Group's 2024 data, accelerators benefit a minority of reps. Design the base rate for the median rep — the one at 80-100% attainment — not for the exceptions at 150%.
Tracking whether rates are working
The clearest sign a commission rate is miscalibrated: attrition patterns. If your top performers leave more than your average performers, your rate probably doesn't reward excellence — either because accelerators are too small or quota is set too high. If median performers leave, your base rate is below market.
Commission data also reveals miscalibrations that aren't visible in OTE benchmarks. If reps consistently earn 20-30% below their variable target even at average quota attainment, the effective rate is lower than the stated rate. That gap usually signals a plan design issue — quota set too high, metrics too hard to hit, or pipeline that doesn't support stated targets.
Tools like Carvd surface effective commission rates alongside stated rates, so you can see the gap between what the plan promises and what reps are actually earning before it turns into an attrition problem.
For a broader view on how commission rates connect to plan structure, see the sales commission structure guide. For SaaS-specific benchmarks, see SaaS sales commission rates.
Last updated: March 23, 2026