Sales Commission Rates by Industry (2026 Data)
Sales commission rates vary from 2% to 120% depending on the industry. Here are verified benchmarks for SaaS, real estate, insurance, pharma, manufacturing, and more.
Sales commission rates aren't universal. A SaaS AE, an insurance agent, a medical device rep, and a manufacturers' representative all sell for a living — and their commission structures look nothing alike.
The range is wider than most people expect: from 2–5% on property and casualty insurance renewals, to 55–120% of the first-year premium for new life insurance policies. Understanding where your industry sits — and why — is the starting point for building a comp plan that attracts reps and stays financially sustainable. You can look up your industry's typical range instantly with the commission rate benchmarks tool.
Here's what the data actually shows across nine major industries.
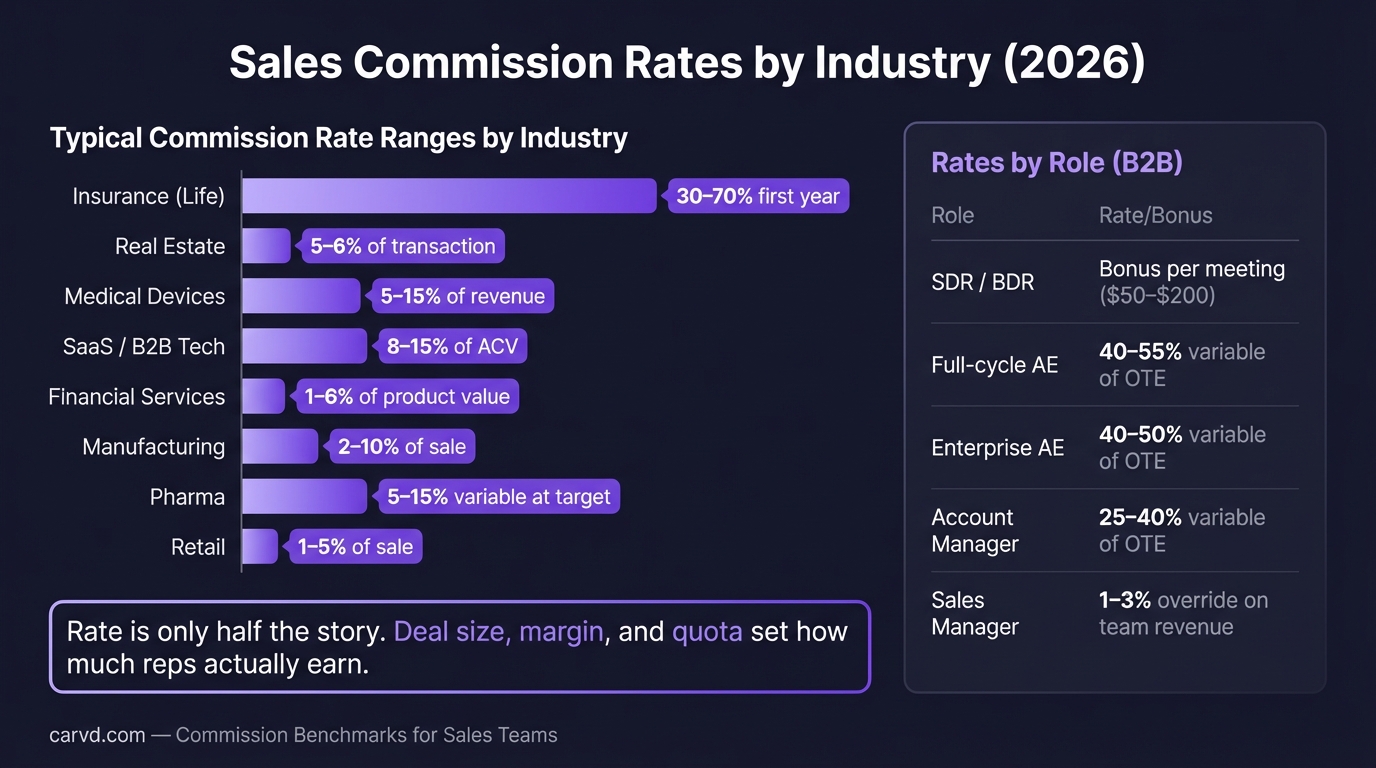
Commission rates by industry: a summary
| Industry | Typical commission rate | Structure |
|---|---|---|
| SaaS / Software | 8–15% of ACV | % of contract value |
| Real estate | 2.67–2.77% per side (5.44% total) | % of sale price |
| Insurance (life) | 55–120% year 1; 1–5% renewals | % of premium |
| Insurance (P&C) | 2–5% new; 2–5% renewals | % of premium |
| Financial services | Largely fee-based; 3–6% transaction | % of AUM or transaction |
| Pharmaceutical | 5–15% of sales | % of territory revenue |
| Medical devices | Varies by product; avg OTE ~$155K | % of revenue + base |
| Manufacturing / Industrial | 5–15% of net sales | % of revenue |
| Staffing / Recruiting | 15–25% of first-year salary | % of placed candidate salary |
Sources: Bridge Group 2024 AE Benchmark, Clever Real Estate 2026, Mira Health, Cerulli Associates 2024, Everstage 2025, MDliaison, MANA, Techneeds 2025
SaaS and software sales
Commission rate: 8–15% of Annual Contract Value
Bridge Group's 2024 AE Metrics & Compensation Benchmark — based on 170+ B2B SaaS companies — found a median commission rate of 11.5% of ACV at 100% quota attainment. The range tightens by segment:
- SMB AEs: 10–15% of ACV (higher rates offset smaller deals)
- Mid-market AEs: 8–12% of ACV
- Enterprise AEs: 5–8% of ACV (lower rates, much larger deal sizes)
The pay mix across all SaaS AEs runs roughly 53% base / 47% variable, according to the same Bridge Group data. ICONIQ Growth's August 2025 GTM Compensation Guide puts later-stage SDR splits at 64/36 base-to-variable — consistent with the principle that reps with shorter sales cycles carry more variable.
Accelerators are standard: 82% of SaaS startups use accelerators above quota, and fewer than 15% cap commission at quota (Prowi 2026 analysis of Bridge Group data). Reps who exceed quota often earn commissions at 1.25x–1.5x the base rate on overachievement.
Quota-to-OTE ratio: the Bridge Group 2024 median is 4.2x, with a healthy range of 3.2x–4.8x. ICONIQ recommends 5x–7x for sustainable sales cost structure.
Real estate
Commission rate: 5.44% total; ~2.67–2.77% per side
Clever Real Estate's 2026 survey puts the national average total commission at 5.44% — split between the listing agent (avg. 2.77%) and buyer's agent (avg. 2.67%). State ranges run from 4.86% in Washington to 6.12% in Oklahoma.
Rates actually edged up slightly in 2025 after the NAR settlement (August 2024) was expected to push them down. According to PR Newswire's one-year NAR data, agent commissions ran modestly higher in 2025 than the pre-settlement period. The settlement changed how buyer's agent compensation is disclosed and negotiated — buyers must now agree to agent fees directly rather than having them bundled into MLS listings — but competition has kept rates relatively stable.
Real estate is unique: the commission is a percentage of a large asset, not of revenue generated. A 2.77% listing commission on a $600,000 home is $16,620 — a single-transaction payout most SaaS reps would consider exceptional.
Insurance
Commission rates: 2–120% depending on product and policy year
Insurance commission rates are the most variable of any industry because they're structured to front-load compensation on new business.
Life insurance (independent agents):
- Year 1: 55–120% of first-year premium (independent agents); 40–90% more typical for captive agents
- Renewal years: 1–5%
A rep who sells a $2,000/year whole life policy might earn $1,400–$2,400 in year one, then $20–100 per year on renewals. This front-loading creates strong incentive to write new business.
Property & Casualty (home, auto, commercial):
- New business: 2–5% of annual premium
- Renewals: 2–5% of annual premium
P&C commissions are more stable because premiums renew annually and retention matters. An agent building a book of business is building a recurring income stream.
Health insurance:
- 4–10% of annual premium; captive agents often 5–6%
Insurance is also industry-specific in that captive agents (who sell only one company's products) typically earn lower rates than independent agents who broker across carriers.
Financial services and wealth management
Commission rates: Increasingly irrelevant — most advisors are fee-based
The financial services industry has shifted substantially away from commission-based compensation. Cerulli Associates (2024) found that more than 72% of financial advisors are now compensated through fee-based models, with commission-based revenue accounting for just 23% of average advisor revenue.
For advisors still earning commissions on transactions:
- Typical transaction commission: 3–6% of transaction value
- AUM-based advisory fees: median 1.02% for a $1M portfolio, declining to ~0.75% at $2M and ~0.50% at $5M+
Broker-dealer payout grids operate differently: the firm sets a gross dealer concession and pays the producing rep 20–110% of that concession depending on production volume. A rep at a wirehouses with high production might keep 40–50% of gross revenue; an independent at a high-payout RIA might keep 80–90%.
The regulatory environment (Regulation Best Interest, state fiduciary rules) has accelerated the shift to fee-based models because commissions on transactions create apparent conflicts of interest.
Pharmaceutical sales
Commission rate: 5–15% of territory sales; base-heavy structure
Pharma sales compensation skews heavily toward base salary. Pay mixes of 60/40 or 70/30 (base:variable) are standard — a meaningful difference from SaaS's 50/50. Reps in pharma are generally expected to build long-term relationships with physicians and healthcare systems, with sales cycles measured in months or quarters.
Average total compensation for pharma reps runs approximately $44,798 in commission income annually against a strong base. The BLS May 2024 data puts median total compensation for pharmaceutical manufacturing sales representatives at $103,600.
Territory-based quotas (market share, prescription volume, or units) rather than contract-value quotas are more common in pharma — which is why the 5–15% figure above describes a rep's share of territory performance rather than a specific deal percentage.
Medical devices
Commission rate: Varies widely by product category; average OTE ~$155K
Medical device sales commission rates are difficult to standardize because product categories vary so dramatically in deal size, sales cycle, and buyer sophistication.
MDliaison's compensation benchmark data puts average total compensation for medical device sales reps at $155,638, with starting compensation for 0–2 years of experience at $98,349. RepVue data shows a median OTE of approximately $160,000 (base ~$68,000 + variable ~$92,000).
Specialty areas command the highest rates:
- Orthopedic and spine implants: among the highest earning segments, often with per-procedure arrangements
- Cardiovascular devices: high-complexity, high-earning
- Capital equipment: large one-time deals with lower per-unit rates
The base-to-variable mix in medical devices typically runs 50/50 to 60/40, depending on whether the rep sells consumables (more variable-friendly) or capital equipment (longer cycles, more base-heavy).
Manufacturing and industrial B2B
Commission rate: 5–15% of net sales for independent reps
For manufacturers' representatives (independent agents who sell on behalf of manufacturers), MANA (Manufacturers' Agents National Association) has historically benchmarked commission rates at 5–15% of net sales — with significant variation by product complexity, exclusivity, and market conditions.
When calculated on gross margin rather than revenue, independent rep commissions often run 20–40% of margin.
In-house manufacturing sales reps typically earn lower commission rates (3–8% of revenue) in exchange for salary and benefits. Complex, custom-engineered products tend toward the higher end of the range because the sales process requires significant technical expertise.
Staffing and recruiting
Commission rate: 15–25% of first-year salary (direct hire); 25–31% for retained search
Staffing and recruiting operate on a fundamentally different model: the commission is a placement fee calculated as a percentage of the placed candidate's first-year salary.
- Direct hire (contingent): 15–25% of first-year salary; Techneeds 2025 data puts the average at ~15.84%, with faster-growing agencies averaging 16.91%
- Executive/retained search: 25–31% of projected first-year compensation, often with a retainer paid upfront
- Temp staffing: Agencies mark up the worker's bill rate 25–71% (average 35–41%); the individual recruiter's commission on placements is a fraction of that markup
A recruiter who places a $120,000 VP of Sales earns their agency $18,000–$30,000 in fees. Their personal commission depends on how their split arrangement works — many recruiters keep 20–30% of the fee, with production bonuses for high volume.
Commission rate by role (cross-industry)
Role determines commission structure as much as industry does. Here's how rates typically break down by function:
| Role | Commission structure | Pay mix |
|---|---|---|
| SDR / BDR | Per-meeting or per-SQL bonus; 2–5% of pipeline | 65/35 base:variable |
| AE (SMB) | 10–15% of ACV | 50/50 |
| AE (mid-market) | 8–12% of ACV | 50/50 |
| AE (enterprise) | 5–8% of ACV | 55/45 base-heavy |
| Account Manager | 5–10% of renewal/upsell ACV | 65/35 |
| Sales Manager | 2–3% override on team revenue | 65/35 |
Source: Bridge Group 2024, ICONIQ GTM Compensation Guide August 2025, Prowi 2026
SDRs are the outlier: most aren't paid a percentage of deal value because they don't own the close. Instead, they're compensated on activity metrics — qualified meetings set, SQLs delivered — that tie to pipeline contribution.
What drives commission rate differences
Average deal size. Smaller deals require higher percentage rates to generate meaningful rep income. A SaaS tool at $2,000 ACV needs a 20% commission rate to create a $400 payout. An enterprise software deal at $200,000 ACV can work at 8% because the absolute payout is $16,000.
Sales cycle length. Longer cycles require more base salary to keep reps financially stable during dry periods. Enterprise AEs and pharma reps skew base-heavy; high-velocity SMB reps can tolerate more variable.
Transaction frequency. Insurance renewal commissions are low because they recur annually without much additional rep effort. New-business commissions are high to compensate for the acquisition work.
Competition for talent. Industries where qualified reps are scarce pay more. Technical medical device and financial services roles command premium compensation because the domain knowledge barrier is high. Once you've settled on competitive rates, you can model the full plan — including accelerators and pay mix — in a commission plan builder.
Margin structure. Software margins (70–80%+) support higher commission rates. Manufacturing margins (15–30%) constrain what's sustainable without eroding profitability.
Tracking commission across these structures
Commission tracking is relatively straightforward for flat-rate plans. It gets harder when you're managing tiered accelerators, territory overrides, product-specific rates, or split credit between reps.
Most teams start with spreadsheets — which work until you have more than one plan type, more than 10 reps, or more than one product line. Tools like Carvd automate commission calculation across plan types and give reps real-time visibility into their earnings via rep dashboards, so you spend less time explaining the math and more time closing. For a side-by-side comparison with other commission tools, see how Carvd compares to QuotaPath.
For a broader look at what benchmarks to use when designing or evaluating a comp plan, see our average sales commission percentage guide — the pillar reference for this cluster.
Related reading:
Last updated: March 23, 2026